Website management and User Experience

Heatmaps with Hotjar

heatmap of Langsdale Library's website homepage

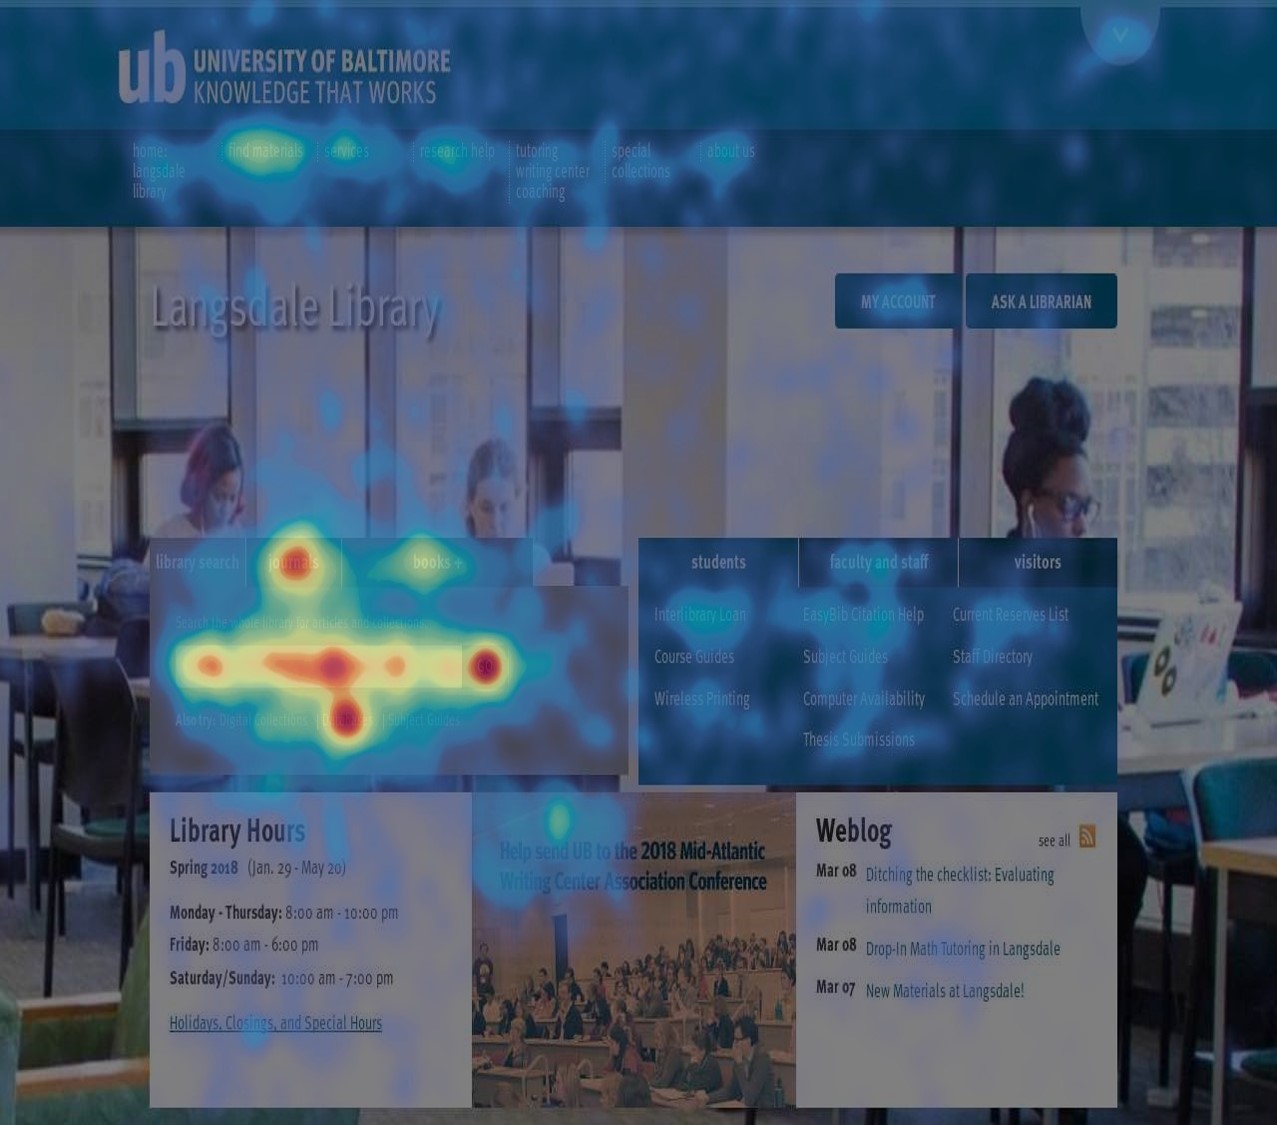
“A picture is worth a thousand words,” so goes the old saying. When it comes to web design, heatmaps provide a powerful illustration of this principle. Heatmaps show an aggregation of users’ clicks and mouse movement on your webpage. User activity is represented through a color gradient, blue or green coloration indicate areas of the page with lower levels of activity and yellow, orange, and red signify areas of high user activity. The visual nature of heatmaps make them a key concept that should be in the toolbox of any library web designer or administrator. Often web librarians need to work hard to advocate for (or against!) changes to the library website. Whether these conversations happen within the library or with an outside web development company, heatmaps can help bolster your argument that specific elements on your site are worth significant attention and improvement given their high levels of user…

Education

LITA Webinar: Beyond Web Page Analytics

Or how to use Google tools to assess user behavior across web properties. Tuesday March 31, 2015 11:00 am – 12:30 pm Central Time Register now for this webinar This brand new LITA Webinar shows how Marquette University Libraries have installed custom tracking code and meta tags on most of their web interfaces including: CONTENTdm Digital Commons Ebsco EDS ILLiad LibCal LibGuides WebPac, and the General Library Website The data retrieved from these interfaces is gathered into Google’s Universal Analytics Tag Manager, and Webmaster Tools When used in combination these tools create an in-depth view of user behavior across all these web properties. For example Google Tag Manager can grab search terms which can be related to a specific collection within Universal Analytics and related to a particular demographic. The current versions of these tools make systems setup an easy process with little or no programming experience required. Making sense…