
“A picture is worth a thousand words,” so goes the old saying. When it comes to web design, heatmaps provide a powerful illustration of this principle. Heatmaps show an aggregation of users’ clicks and mouse movement on your webpage. User activity is represented through a color gradient, blue or green coloration indicate areas of the page with lower levels of activity and yellow, orange, and red signify areas of high user activity.
The visual nature of heatmaps make them a key concept that should be in the toolbox of any library web designer or administrator. Often web librarians need to work hard to advocate for (or against!) changes to the library website. Whether these conversations happen within the library or with an outside web development company, heatmaps can help bolster your argument that specific elements on your site are worth significant attention and improvement given their high levels of user activity, or that other elements should be eliminated due to their lack of use.
During the Spring 2018 semester, I ran heatmaps on 3 of our pages: our library homepage; the services menu for the Achievement and Learning Center (ALC), housed within the library; and the ALC’s information-heavy “Workshops” page. Below is the homepage heatmap, along with a plain screenshot of the homepage for reference.
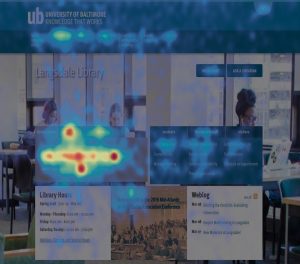

As you can see, the heatmap powerfully illustrates that user activity on our homepage is overwhelmingly focused on our tabbed search box. Note that the red circle centered beneath the search box’s input field is actually a text link to our databases A-Z page, clearly also quite popular with our users.
Lack of activity is also eloquently shown in this heatmap, in that there is almost an absence of color on the Ask a Librarian button in the top-right corner of the page. Perhaps users do not understand what will happen when they click this button, or perhaps they just do not feel a compelling need to chat with a librarian. Further user research would be necessary to come to a reliable conclusion, but the heatmap has given us some questions to ask!
Happily, it is not too difficult to start generating your own heatmaps. There are many third-party websites that allow you to run heatmaps for free on your own pages. I’ve used both heatmap.it and Hotjar. I prefer Hotjar because it offers a more robust interface and features beyond just heatmaps. If you’re reading along and this sounds interesting to you, note that, in order to use Hotjar, you’ll need source code access on your website to place a code snippet in the head section of webpages you wish to track. Another option, if you’re using Google Tag Manager, is to take advantage of that product’s built-in ability to integrate with Hotjar.
Hotjar offers a multitude of convenient features for their heatmap tool. Every heatmap segments your page traffic by device (desktop/tablet/smartphone) so that you can see differences in user interaction across devices. This is particularly helpful if you have a responsive website, where the layout changes for smaller screen sizes.
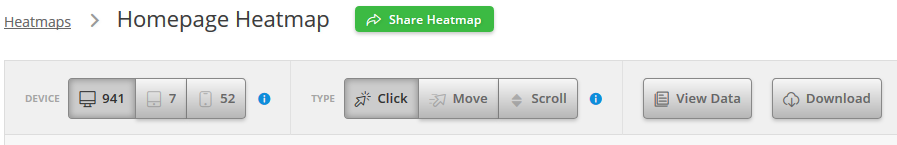
Hotjar heatmaps record three types of user interaction: clicks on the page, mouse movement, and scrolling. The scrolling heatmap tells you where the average “fold” occurs on your page, allowing you to see what content a user will readily see without scrolling at all. Hotjar heatmaps stay active until they reach 1,000 pageviews (you can pause them along the way), at which point they automatically stop. Not every pageview is tracked on the heatmap; there is a sampling algorithm that controls which user sessions are recorded, and it is also possible to block interactions from specific IP addresses from being recorded. IP address blocking can be convenient if you want to weed out traffic to your page from the information desk PC or from various staff workstations.
Unfortunately there is a limit of 3 heatmaps for the free account, but there is an export option which allows for download of the heatmap images as .jpg files, or a download of the data as a .csv file. When one of my heatmaps gets to 1,000 pageviews, I routinely export all available images and data for that heatmap and then delete the heatmap so that I have space for my next heatmap.
Perhaps you’ve never tried using heatmaps. Maybe you’ve heard the term before but haven’t had time to dig in and learn about them. Whatever the case, I encourage you to make a list of 1-3 pages on your library’s website where you would like to have a better picture of users’ interactions with the site. Then, if you’re in a position to run with the ball and directly implement a heatmap tracking snippet on your pages, get it done and let data start rolling in! If, on the other hand, you’re passionate about website user experience but don’t have much direct influence to make changes, I encourage you to have some conversations about the benefits of implementing heatmaps with your resident webmaster, or your library’s website committee, or whoever the appropriate decision makers are in your context.
Got a success story of using heatmaps to advocate for changes to your website? Please share it in the comments!